
“Time is a Flat Football” is a series of posts which will explore players from Michigan football history members of the 2015 team resembles the most. Tackled in these posts will be the offensive “skill” position groups: Quarterbacks, Running Backs, and Receivers/Tight Ends. My apologies go out to the offensive line, but it’s very difficult to get o-line statistics, and more difficult to compare the groups. I used Python and Pandas almost exclusively for this quick trip to the past, which is intended mostly to be a “Diary” post on the MGoBlog website. Any “predictions” can be described as unscientific, but kind of fun.
Disclaimer: Obviously caveats do apply here. These are namely the effects of other position groups, coaching, and style of offense on the players being analyzed. Also, the past probably has no bearing on what current players will do, unless you believe Rust Cohle. I plan to deal with these issues by completely ignoring them. It’s the off season, people.
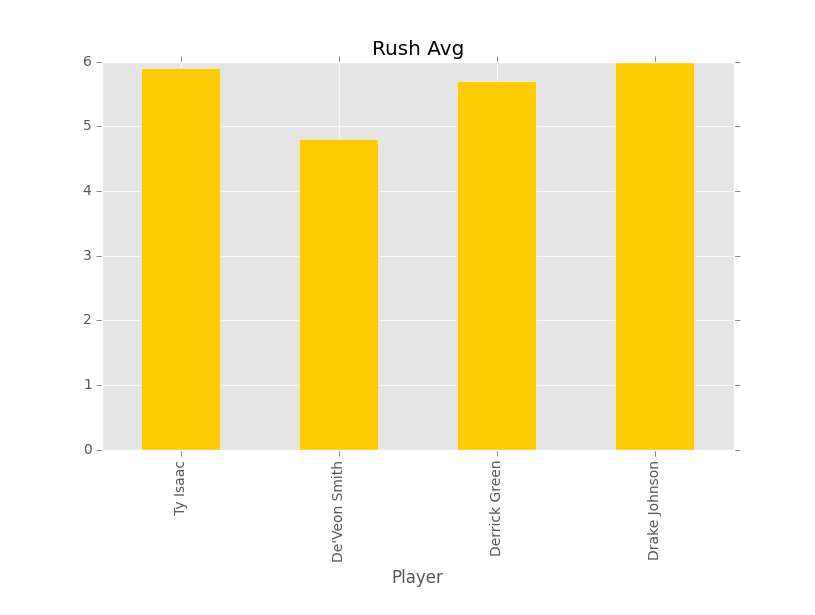
Michigan has an interesting mix of running backs this year. Junior backs Derrick Green and De’Veon Smith were highly rated coming out of high school, but neither have locked up the feature back role at this point. Drake Johnson is heading into his senior year after a promising junior season which unfortunately ended after a knee injury. Newly eligible Ty Isaac will be a RS sophomore after taking a year off following his transfer from USC. It’s a crowded but talented backfield, and at this point, not much separates them. Let’s take a look at their stats, gathered from sports-reference.com. Here are their stats throughout the years they have been active.
| Yr | Cls | Player | Rush Att | Rush Yds | Rush Avg | Rush Td | Rec | Rec Yds | Rec Avg | Rec Td | Plays Tot | Yds Tot | Avg Tot | TD Tot |
|---|---|---|---|---|---|---|---|---|---|---|---|---|---|---|
| 2013 | 1 | Derrick Green | 83 | 270 | 3.3 | 2 | 0 | 0 | 0 | 0 | 83 | 270 | 3.3 | 2 |
| 2013 | 1 | De’Veon Smith | 26 | 117 | 4.5 | 0 | 0 | 0 | 0 | 0 | 26 | 117 | 4.5 | 0 |
| 2013 | 1 | Ty Isaac | 40 | 236 | 5.9 | 2 | 4 | 57 | 14.3 | 0 | 44 | 293 | 6.7 | 2 |
| 2014 | 2 | De’Veon Smith | 108 | 519 | 4.8 | 6 | 3 | 26 | 8.7 | 0 | 111 | 545 | 4.9 | 6 |
| 2014 | 2 | Derrick Green | 82 | 471 | 5.7 | 3 | 2 | 26 | 13.0 | 0 | 84 | 497 | 5.9 | 3 |
| 2014 | 3 | Drake Johnson | 60 | 361 | 6.0 | 4 | 1 | 11 | 11.0 | 0 | 61 | 372 | 6.1 | 4 |
We can also look at the totals for each player:
| Yr | Cls | Player | Rush Att | Rush Yds | Rush Avg | Rush Td | Rec | Rec Yds | Rec Avg | Rec Td | Plays Tot | Yds Tot | Avg Tot | TD Tot |
|---|---|---|---|---|---|---|---|---|---|---|---|---|---|---|
| 2014 | 2 | Derrick Green | 165 | 741 | 4.5 | 5 | 0 | 0 | 0 | 0 | 167 | 767 | 4.6 | 5 |
| 2014 | 2 | De’Veon Smith | 134 | 636 | 4.65 | 6 | 0 | 0 | 0 | 0 | 137 | 662 | 4.7 | 6 |
| 2014 | 3 | Drake Johnson | 60 | 361 | 6 | 4 | 1 | 11 | 11 | 0 | 61 | 372 | 6.1 | 4 |
| 2013 | 1 | Ty Isaac | 40 | 236 | 5.9 | 2 | 4 | 57 | 14.3 | 0 | 44 | 293 | 6.7 | 2 |
Green and Johnson were each having promising seasons last year before going down with injuries. De’Veon Smith put up a relatively good season, especially considering he spent most of the year splitting carries with Green and Johnson. Isaac’s freshman year at USC was good for a freshman back who was not the featured guy. Let’s find some comparisons to past Michigan running backs from past years.
Derrick Green

| Yr | Cls | Player | Rush Att | Rush Yds | Rush Avg | Rush Td | Rec | Rec Yds | Rec Avg | Rec Td | Plays Tot | Yds Tot | Avg Tot | TD Tot |
|---|---|---|---|---|---|---|---|---|---|---|---|---|---|---|
| 1984 | 2 | Bob Perryman | 76 | 393 | 5.2 | 5 | 2 | 15 | 7.5 | 1 | 78 | 408 | 5.2 | 6 |
| 1991 | 1 | Tyrone Wheatley | 86 | 548 | 6.4 | 9 | 10 | 90 | 9.0 | 0 | 96 | 638 | 6.6 | 9 |
| 2000 | 1 | Chris Perry | 77 | 417 | 5.4 | 5 | 0 | 0 | 0 | 0 | 77 | 417 | 5.4 | 5 |
| 2007 | 2 | Carlos Brown | 75 | 382 | 5.1 | 4 | 0 | 0 | 0 | 0 | 75 | 382 | 5.1 | 4 |
| 2014 | 2 | Derrick Green | 82 | 471 | 5.7 | 3 | 2 | 26 | 13.0 | 0 | 84 | 497 | 5.9 | 3 |
Derrick Green’s sophomore campaign ended after just 6 games, so his stats ended up looking like players coming off the bench. As you can see in the chart above, Green is in good company. Freshmen Tyrone Wheatley and Chris Perry are very similar to sophomore Green. No one on the list is a prolific pass catcher, which makes comparisons easier. Arguably the best metric to judge running backs by is Rush Avg, AKA yards/carry. Let’s see who’s similar here, and throw in TDs just to compare.
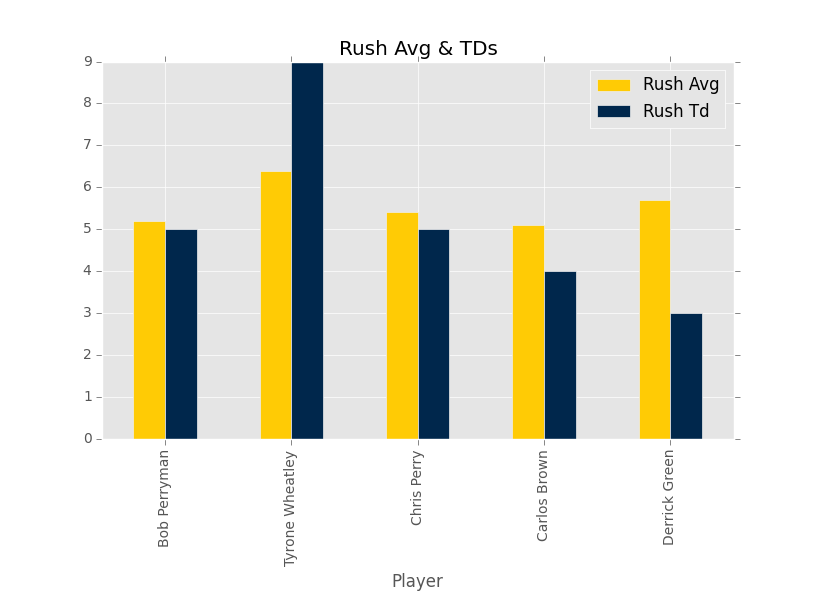
Green’s 5.7 Yds/Carry looks very similar to freshman Chris Perry’s 5.4 average. Freshman Tyrone Wheatley’s 6.4 Yds/Carry represents the top of the comparisons, and he was much more of a TD vulture than Green has been. Carlos Brown’s sophomore campaign looks somewhat similar as well. Let’s see how these running backs fared in their next year.
| Yr | Cls | Player | Rush Att | Rush Yds | Rush Avg | Rush Td | Rec | Rec Yds | Rec Avg | Rec Td | Plays Tot | Yds Tot | Avg Tot | TD Tot |
|---|---|---|---|---|---|---|---|---|---|---|---|---|---|---|
| 1985.0 | 3.0 | Bob Perryman | -11.00 | -154.0 | -1.5 | -5 | 5 | 61 | 3.4 | -1 | -6.00 | -93.00 | -0.80 | -6.0 |
| 1992.0 | 2.0 | Tyrone Wheatley | 99.00 | 809.0 | 0.9 | 4 | 3 | 55 | 2.2 | 3 | 102.00 | 864.00 | 1.00 | 7.0 |
| 2001.0 | 2.0 | Chris Perry | 35.00 | 39.0 | -1.3 | -3 | 0 | 0 | 0 | 0 | 41.00 | 85.00 | -1.10 | -3.0 |
| 2008.0 | 3.0 | Carlos Brown | -46.00 | -260.0 | -0.9 | -4 | 0 | 0 | 0 | 0 | -40.00 | -237.00 | -1.00 | -4.0 |
| 2.5 | Mean | 19.25 | 108.5 | -0.7 | -2 | 4 | 58 | 2.8 | 1 | 24.25 | 154.75 | -0.48 | -1.5 |
Every running back outside of Tyrone Wheatley saw a decrease in their Yds/Carry. The average running back saw an increased workload of about 20 carries, good for an extra 100 yds. Coach Wheatley is really skewing the numbers here. He took the leap from “damn, that guy’s good for a freshman” to “damn, that guy’s good”. This is the type of jump we are hoping for with Green.
If I had to make one prediction based on this data, I’d say that Green’s Yds/Carry will go down this year. Should he win the feature back role, I have no doubt that he’ll be relatively consistent. However, the progression for the comparable backs above shows that if you’re not Tyrone Wheatley (and most people aren’t) you’ll come back to earth.
Bottom Line: Derrick Green should have a season similar to Sophomore Chris Perry (2001).
| Yr | Rk | Player | Cls | Rush Att | Rush Yds | Rush Avg | Rush Td | Rec | Rec Yds | Rec Avg | Rec Td | |
|---|---|---|---|---|---|---|---|---|---|---|---|---|
| 2001 | 2 | Chris Perry | 2 | 112 | 456 | 4.1 | 2 | 6 | 46 | 7.7 | 0 |
The 2001 team won 8 games and lost 4. Chris Perry split carries that year with B.J. Askew, who had a good season as well. At this point it’s tough to see much separation between all four candidates for the feature back role. Barring a surprise breakout, this should translate to a running back by committee simply for the sake of fresh legs.
De’Veon Smith
De’Veon Smith is another applicant for the feature back position. In the wake of losing Green to a broken clavicle, Smith saw the most carries on the 2014 team. However, Drake Johnson started stealing carries towards the end of the year before he too went down with an injury. Let’s see to whom Smith is most comparable.
| Yr | Cls | Player | Rush Att | Rush Yds | Rush Avg | Rush Td | Rec | Rec Yds | Rec Avg | Rec Td | Plays Tot | Yds Tot | Avg Tot | TD Tot |
|---|---|---|---|---|---|---|---|---|---|---|---|---|---|---|
| 1984 | 1 | Jamie Morris | 118 | 573 | 4.9 | 2 | 14 | 131 | 9.4 | 0 | 132 | 704 | 5.3 | 2 |
| 1993 | 2 | Ed Davis | 93 | 441 | 4.7 | 2 | 11 | 89 | 8.1 | 0 | 104 | 530 | 5.1 | 2 |
| 1997 | 1 | Anthony Thomas | 130 | 529 | 4.1 | 5 | 21 | 205 | 9.8 | 0 | 151 | 734 | 4.9 | 5 |
| 2001 | 2 | Chris Perry | 112 | 456 | 4.1 | 2 | 6 | 46 | 7.7 | 0 | 118 | 502 | 4.3 | 2 |
| 2008 | 1 | Sam McGuffie | 118 | 486 | 4.1 | 3 | 19 | 175 | 9.2 | 1 | 137 | 661 | 4.8 | 4 |
| 2014 | 2 | De’Veon Smith | 108 | 519 | 4.8 | 6 | 3 | 26 | 8.7 | 0 | 111 | 545 | 4.9 | 6 |
The comparison which leaps out is Smith’s sophomore season to Jamie Morris’ freshman season. Attempts and Rush Avg are very similar. Morris was more involved in the passing game than Smith, but their Rec Avgs are similar (Smith’s sample size is miniscule, though). Let’s explore the similarities graphically because we can!
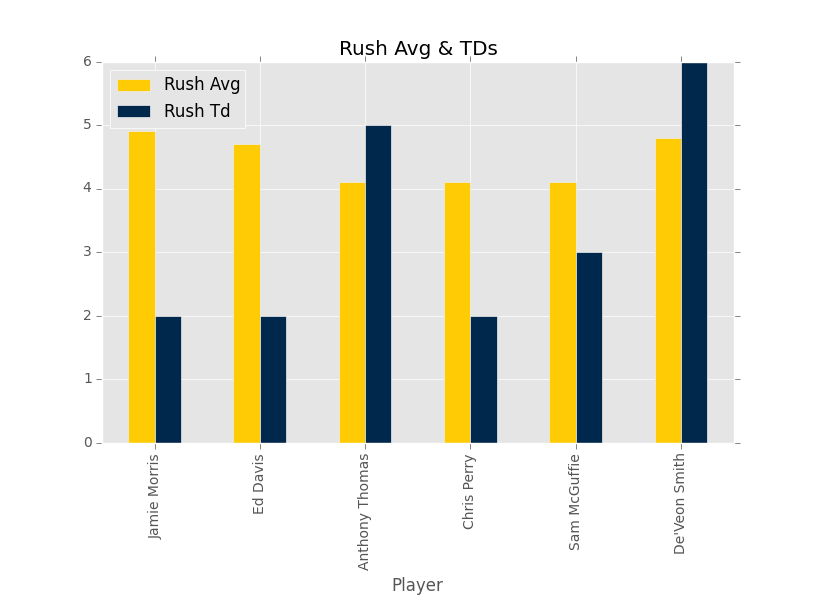
In addition to Jamie Morris, De’Veon Smith looks a lot like sophomore Ed Davis with more TDs. De’Veon Smith, much like Green, is in good company with the other players included in the comparisons. Chris Perry and Anthony Thomas were eventually drafted in the 1st and 2nd rounds, and Sam McGuffie jumped over multiple guys (a habit he has yet to break). McGuffie left after one year, but let’s see how the rest of the guys progressed.
| Yr | Cls | Player | Rush Att | Rush Yds | Rush Avg | Rush Td | Rec | Rec Yds | Rec Avg | Rec Td | Plays Tot | Yds Tot | Avg Tot | TD Tot |
|---|---|---|---|---|---|---|---|---|---|---|---|---|---|---|
| 1985 | 2.0 | Jamie Morris | 79.0 | 457.0 | 0.30 | 1.0 | 19.00 | 85.00 | -2.90 | 1.00 | 98.0 | 542.0 | 0.10 | 2.0 |
| 1994 | 3.0 | Ed Davis | -13.0 | -102.0 | -0.50 | 1.0 | -2.00 | -53.00 | -4.10 | 0.00 | -15.0 | -155.0 | -0.90 | 1.0 |
| 1998 | 2.0 | Anthony Thomas | 16.0 | 232.0 | 1.10 | 7.0 | -6.00 | -65.00 | -0.50 | 0.00 | 10.0 | 167.0 | 0.70 | 7.0 |
| 2002 | 3.0 | Chris Perry | 155.0 | 654.0 | 0.10 | 12.0 | 8.00 | 110.00 | 3.40 | 0.00 | 163.0 | 764.0 | 0.20 | 12.0 |
| 2.4 | Mean | 59.25 | 310.25 | 0.25 | 5.75 | 4.75 | 19.25 | -1.03 | 0.25 | 64.00 | 329.50 | 0.03 | 5.5 |
Most of these players took a major leap forwards in multiple stats. It seems as though once a player has reached a De’Veon Smith level of contribution, the next year they are expected to take on a more significant role in the offense. The average running back got about 60 more carries, 310 more yards, and gained 0.25 more yards/carry.
The players most similar to Smith (Morris and Davis) represent opposite trajectories. Morris became the feature back and would keep that role until he graduated. Ed Davis continued to split carries until he graduated.
Bottom Line: If he wins the feature back role, De’Veon Smith could have a season similar to Sophomore Jamie Morris (1985).
| Yr | Cls | Player | Rush Att | Rush Yds | Rush Avg | Rush Td | Rec | Rec Yds | Rec Avg | Rec Td | Plays Tot | Yds Tot | Avg Tot | TD Tot |
|---|---|---|---|---|---|---|---|---|---|---|---|---|---|---|
| 1985 | 2 | Jamie Morris | 197 | 1030 | 5.2 | 3 | 33 | 216 | 6.5 | 1 | 230 | 1246 | 5.4 | 4 |
Morris had a great season by all accounts. Most impressive was his 5.2 yards/carry and the first of three straight 1,000 yd seasons. The 1985 team went 10-1-1 and finished ranked #2 in the country, with Morris being a large part of the offense. Past Wolverines show Smith to be the running back in the most prime position to break out.
Drake Johnson

Drake Johnson came on strong last season before going down with a knee injury. By all accounts he’s been putting in the work to be ready for this season, and with his vision he is definitely in the hunt for the feature back role. Let’s see who Johnson’s 2014 season was reminiscent of.
| Yr | Cls | Player | Rush Att | Rush Yds | Rush Avg | Rush Td | Rec | Rec Yds | Rec Avg | Rec Td | Plays Tot | Yds Tot | Avg Tot | TD Tot |
|---|---|---|---|---|---|---|---|---|---|---|---|---|---|---|
| 1977 | 2 | Roosevelt Smith | 57 | 308 | 5.4 | 4 | 5 | 46 | 9.2 | 0 | 62 | 354 | 5.7 | 4 |
| 1989 | 3 | Allen Jefferson | 65 | 380 | 5.8 | 3 | 3 | 27 | 9.0 | 1 | 68 | 407 | 6.0 | 4 |
| 1992 | 1 | Ed Davis | 61 | 374 | 6.1 | 3 | 3 | 11 | 3.7 | 0 | 64 | 385 | 6.0 | 3 |
| 2007 | 2 | Carlos Brown | 75 | 382 | 5.1 | 4 | 0 | 0 | 0 | 0 | 75 | 382 | 5.1 | 4 |
| 2009 | 1 | Vincent Smith | 48 | 276 | 5.8 | 1 | 10 | 82 | 8.2 | 2 | 58 | 358 | 6.2 | 3 |
| 2010 | 3 | Michael Shaw | 75 | 402 | 5.4 | 9 | 10 | 75 | 7.5 | 0 | 85 | 477 | 5.6 | 9 |
| 2011 | 3 | Vincent Smith | 50 | 298 | 6.0 | 2 | 11 | 149 | 13.5 | 2 | 61 | 447 | 7.3 | 4 |
| 2014 | 3 | Drake Johnson | 60 | 361 | 6.0 | 4 | 1 | 11 | 11.0 | 0 | 61 | 372 | 6.1 | 4 |
Drake Johnson’s profile is similar to just about every change of pace back Michigan has had in recent years, minus the screens. Ed Davis pops up again, and Vincent Smith appears twice. Perennial change of pace backs Carlos Brown and Michael Shaw also appear. The most apt comparison seems to be Ed Davis’ freshman campaign, followed by Vincent Smith’s junior year.
You know the drill: let’s look at the progress they made from the comparison season to the next.
| Yr | Cls | Player | Rush Att | Rush Yds | Rush Avg | Rush Td | Rec | Rec Yds | Rec Avg | Rec Td | Plays Tot | Yds Tot | Avg Tot | TD Tot |
|---|---|---|---|---|---|---|---|---|---|---|---|---|---|---|
| 1978.00 | 3.00 | Roosevelt Smith | 41.00 | 102.00 | -1.20 | -1.00 | 4 | 69.00 | 3.60 | 3.00 | 45.00 | 171.00 | -0.80 | 2.00 |
| 1990.00 | 4.00 | Allen Jefferson | -13.00 | -111.00 | -0.60 | 3.00 | -1 | -5.00 | 2.00 | -1.00 | -14.00 | -116.00 | -0.60 | 2.00 |
| 1993.00 | 2.00 | Ed Davis | 32.00 | 67.00 | -1.40 | -1.00 | 8 | 78.00 | 4.40 | 0.00 | 40.00 | 145.00 | -0.90 | -1.00 |
| 2008.00 | 3.00 | Carlos Brown | -46.00 | -260.00 | -0.90 | -4.00 | 0 | 0 | 0 | 0 | -40.00 | -237.00 | -1.00 | -4.00 |
| 2010.00 | 2.00 | Vincent Smith | 88.00 | 325.00 | -1.40 | 4.00 | 5 | 48.00 | 0.50 | 0.00 | 93.00 | 373.00 | -1.40 | 4.00 |
| 2011.00 | 4.00 | Michael Shaw | -44.00 | -203.00 | 1.00 | -6.00 | -9 | -63.00 | 4.50 | 0.00 | -53.00 | -266.00 | 1.00 | -6.00 |
| 2012.00 | 4.00 | Vincent Smith | -12.00 | -204.00 | -3.50 | 0.00 | -1 | -75.00 | -6.10 | -1.00 | -13.00 | -279.00 | -3.80 | -1.00 |
| 3.14 | Mean | 6.57 | -40.57 | -1.14 | -0.71 | 1 | 8.67 | 1.48 | 0.17 | 8.29 | -29.86 | -1.07 | -0.57 |
The basic gist of this table is that many of these backs have reached their ceiling, and might actually take a step back year-to-year in Rush Avg. While the mean Rush Att and Rush Yd changes are +6.57 and -40.57, respectively, the running backs themselves seem to fall into two categories. The first category includes freshman to sophomore Vincent Smith, freshman to sophomore Ed Davis, and sophomore to junior Roosevelt Smith. Each of these backs saw a significant increase in their carries and a decent uptick in yards. The second group saw just as significant a decrease in usage between years.
The question of which of these groups Drake Johnson will fall into is difficult to answer. Perhaps the most relevant distinction between these two categories is Class. Most upperclassmen with Drake Johnson level production the previous year saw a decrease in touches the following year. All seniors experienced this decrease, as did junior Carlos Brown, although his decrease was entirely injury related. Only junior Roosevelt Smith did not see lower numbers. The two underclassmen, Ed Davis and young Vincent Smith saw increased usage.
Bottom line Given that he’s going into his senior year, I’m most inclined to say Drake Johnson’s final year will mirror that of Senior Michael Shaw (2011).
| Yr | Cls | Player | Rush Att | Rush Yds | Rush Avg | Rush Td | Rec | Rec Yds | Rec Avg | Rec Td | Plays Tot | Yds Tot | Avg Tot | TD Tot |
|---|---|---|---|---|---|---|---|---|---|---|---|---|---|---|
| 2011 | 4 | Michael Shaw | 31 | 199 | 6.4 | 3 | 1 | 12 | 12 | 0 | 32 | 211 | 6.6 | 3 |
The 2011 went 11-2 and won the Sugar Bowl. Shaw saw a small share of the rushing load with Denard, Fitz Toussaint, and junior Vincent Smith getting more carries. Carries were difficult to come by for Shaw behind these backs, a problem which will also be faced by Johnson.
Ty Isaac

Ty Isaac is the outside challenger this year. After a decent freshman season with USC, Isaac transferred to Michigan, finally completing the Justin Fargas trade. Isaac’s 2013 freshman season was similar to a few familiar names.
| Yr | Cls | Player | Rush Att | Rush Yds | Rush Avg | Rush Td | Rec | Rec Yds | Rec Avg | Rec Td | Plays Tot | Yds Tot | Avg Tot | TD Tot |
|---|---|---|---|---|---|---|---|---|---|---|---|---|---|---|
| 2006 | 1 | Brandon Minor | 42 | 238 | 5.7 | 2 | 1 | 9 | 9.0 | 0 | 43 | 247 | 5.7 | 2 |
| 2008 | 1 | Michael Shaw | 42 | 215 | 5.1 | 0 | 6 | 32 | 5.3 | 1 | 48 | 247 | 5.1 | 1 |
| 2009 | 1 | Vincent Smith | 48 | 276 | 5.8 | 1 | 10 | 82 | 8.2 | 2 | 58 | 358 | 6.2 | 3 |
| 2013 | 1 | Ty Isaac | 40 | 236 | 5.9 | 2 | 4 | 57 | 14.3 | 0 | 44 | 293 | 6.7 | 2 |
If you’ve made it this far, you’re acquainted with two of these names already. Freshmen Michael Shaw and Vincent Smith were similar to Isaac in most stats. Brandon Minor’s first year was similar to Isaac’s in many ways as well. Let’s see how the sophomores stack up.
| Yr | Cls | Player | Rush Att | Rush Yds | Rush Avg | Rush Td | Rec | Rec Yds | Rec Avg | Rec Td | Plays Tot | Yds Tot | Avg Tot | TD Tot |
|---|---|---|---|---|---|---|---|---|---|---|---|---|---|---|
| 2007.00 | 2 | Brandon Minor | 48.00 | 147.00 | -1.40 | -1.00 | 2 | -8.00 | -8.70 | 0.00 | 50.00 | 139.00 | -1.50 | -1.00 |
| 2009.00 | 2 | Michael Shaw | 0.00 | -30.00 | -0.70 | 2.00 | -4 | -27.00 | -2.80 | -1.00 | -4.00 | -57.00 | -0.80 | 1.00 |
| 2010.00 | 2 | Vincent Smith | 88.00 | 325.00 | -1.40 | 4.00 | 5 | 48.00 | 0.50 | 0.00 | 93.00 | 373.00 | -1.40 | 4.00 |
| 2 | Mean | 45.33 | 147.33 | -1.17 | 1.67 | 1 | 4.33 | -3.67 | -0.33 | 46.33 | 151.67 | -1.23 | 1.33 |
Minor and Smith saw upticks in usage and yards, but all three regressed a little in Yds/Carry. I really do not believe that Isaac will be like one of these guys, simply because I’m pretty convinced he’ll get at least a third of the carries.
<strong?Bottom Line: No idea. Ty Isaac is a bit of an unknown at this point. Just over 40 touches on a different team is not much to go on. Isaac’s his build suggests he’ll be more Minor than Smith, but his pass catching ability seems closer to the latter than the former.
What Does It All Mean?
I’m not sure that Michigan has a running back on the roster who is ready to be “the guy”. Derrick Green and De’Veon Smith have each shown flashes of being able to handle the entire load, and Johnson looked good in limited action last year. Isaac had a promising freshman season at USC, but it’s difficult to know just what he is. A look at the Yds/Carry shows reveals strong numbers for each back.
These numbers are even more impressive when plotted against every Michigan running back with greater than 20 carries since 1975.
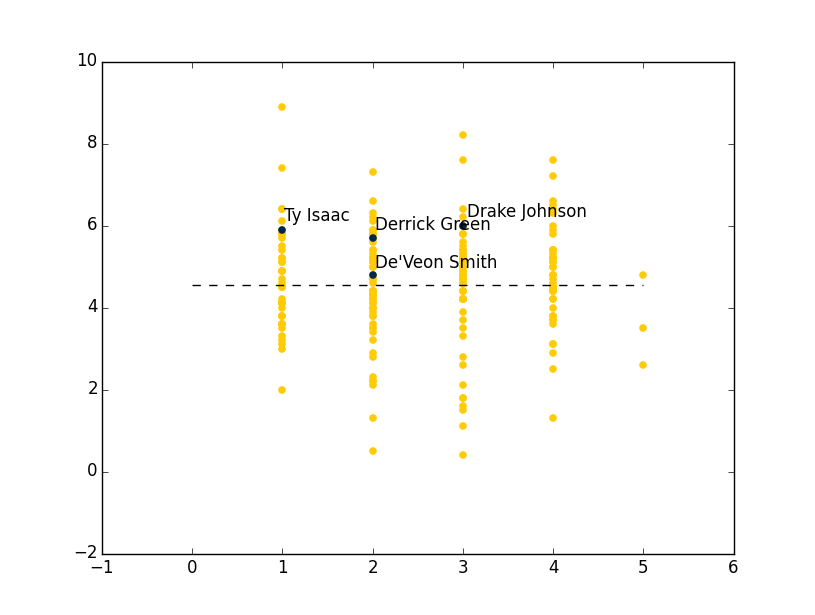
The dotted line represents the absolute average Yds/Carry, and all four backs are well above the line. Those with fewer carries are well above the line, but even De’Veon Smith’s >100 carry season last year put him above average. It looks like Michigan has at least four solid backs, meaning that at the very least we will have a strong committee. At best we might have the next Chris Perry or Jamie Morris. Just who that might be is impossible to answer at this point.