
Since early 2011 I have been using the website Jinni.com to get recommendations on movies and TV shows. Through rating movies on a 1-10 scale, Jinni built an impressive personal taste profile based on a huge variety of factors. It’s been a valuable tool in helping me discover movies I had never even heard of before.
This was all great, except for the fact that Jinni is now shifting their focus away from helping individual users discover new things and moving towards helping companies like Comcast and AT&T target ads. This is actually great news for Jinni, but not so much for me. Still, Jinni was nice enough to send me an email notifying me of the switch. On top of this courtesy, the good folks over at Jinni included an Excel file of all my ratings since I began using the service. In this post I’ll be looking to use the basic data Jinni provided me (Movie Title, Year, My Rating) in conjunction with some data from IMDB about the people behind the movies to discover my favorite directors, writers, and actors.
Reading .xlsx File into DataFrame
I started by importing pandas, BeautifulSoup and urllib. Next I read the xlsx file from Jinni into a Pandas DataFrame.
import pandas as pd
from bs4 import BeautifulSoup
import urllib
MOVRatings = pd.read_excel("C:/Users/.../MyRatings.xlsx")
Next I limited the scope of the new DataFrame I created (MOVRatings) to just movies, not TV Shows.
###Exclude TV shows
MOVRatings = MOVRatings[MOVRatings["title_type"]=="Movie"]
I ran into a problem with the indexes at this point. DataFrames in Pandas are automatically assigned an index for each row starting from 0 counting up by 1 until the end of the data. After dropping the TV shows I was left with a DataFrame with indexes which could look like 10,11,14,16,17 in some places. In order to navigate effectively later I reset the index.
MOVRatings = MOVRatings.reset_index(drop=True)
The last phase of setup here was to add in the columns I’ll eventually use. I’ll initially fill these columns with a value of “NA”.
MOVRatings["IMDB ID"] = "NA"
MOVRatings["Director"]="NA"
MOVRatings["Writers"]="NA"
MOVRatings["Actors"]="NA"
Using the IMDB API
While there is no official IMDB API, I was able to find this stackoverflow thread describing how to search for specific titles and get a response in xml format. Below is the basic structure:
http://www.imdb.com/xml/find?xml=1&nr=1&tt=on&q=lost
In this case “lost” is what we are searching for. The response page from IMDB provides the unique entity ID that IMDB assigns to each TV show or movie. The show “Lost” has an ID of tt0411008. If you were to go to IMDB’s page for Lost, you’d see that ID number at the end of the URL, which looks like this:
http://www.imdb.com/title/tt0411008/
This “title” page for each movie includes a section with names for the Director(s), Writer(s), and Actors; the information I am interested in. In order to access this information it is necessary for me to get the entity ID numbers for each title, which I will then use to access the title page and finally scrape the names. Here’s how I got that done:
imdbAPI = 'http://www.imdb.com/xml/find?xml=1&nr=1&tt=on&q='
imdbPage = 'http://www.imdb.com/title/'

for i, row in MOVRatings.iterrows():               ###this is the syntax for going through a DataFrame, row by row
    title = str(row["title"])                      ###Here I am getting the Movie title for the current row and converting it to a string
    title = title.replace(" ", "%20")              ###Here I'm replacing any spaces in the title to a '%20'
    exemel = urllib.request.urlopen(imdbAPI+title) ###requesting the xml page for the title which has been appended to the imdbAPI above
    soup = BeautifulSoup(exemel)                   ###creating a "soup" object to extract the IMDB entity ID based on tags
    id = soup.imdbentity['id']                     ###looking through the soup to find an imdbentity tag with the value 'id'
    MOVRatings["IMDB ID"].iloc[i]=id               ###assigning the row's IMDB ID column value to the id we just found
Now if I were to look at the MOVRatings table the IMDB ID should show up.
| title | year | title_type | rate | rating_date | rating_source | IMDB ID | |
|---|---|---|---|---|---|---|---|
| 0 | The Monuments Men | 2014 | Movie | 6 | 2015-05-25 00:00:00 | Jinni | tt2177771 |
| 1 | Sleepwalk with Me | 2012 | Movie | 9 | 2015-05-25 00:00:00 | Jinni | tt2077851 |
| 2 | Seven Psychopaths | 2012 | Movie | 6 | 2015-05-25 00:00:00 | Jinni | tt1931533 |
| 3 | Running Scared | 2006 | Movie | 6 | 2015-05-25 00:00:00 | Jinni | tt0404390 |
| 4 | Thor | 2011 | Movie | 5 | 2015-05-25 00:00:00 | Jinni | tt0800369 |
Success! Now on to getting the information. The next step is getting to the main page of each movie and grabbing the names of the directors, writers and actors. Here’s how I accomplished this:
def findDirectors(url):
	directors = []
	titleURL = urllib.request.urlopen(url)
	soup = BeautifulSoup(titleURL)
	for entity in soup.find_all(itemprop='director'):
		for directorTags in entity.find_all(itemprop='name'):
			directors.append(directorTags.get_text())
	return directors

def findWriters(url):
	writers = []
	titleURL = urllib.request.urlopen(url)
	soup = BeautifulSoup(titleURL)
	x = soup.find_all(itemprop='creator')
	x = x[0] ###eliminates the production studio
	for writerTags in x.find_all(itemprop='name'):
		writers.append(writerTags.get_text())
	return writers

def findActors(url):
	actors = []
	titleURL = urllib.request.urlopen(url)
	soup = BeautifulSoup(titleURL)
	for entity in soup.find_all(itemprop='actors'):
		for actorTags in entity.find_all(itemprop='name'):
			actors.append(actorTags.get_text())
	return actors
Here are three nearly identical functions which populate lists of directors, writers, and actors. They request the title page from IMDB, go through the tags, and collect names. Each works nearly identically, with the exception of the findWriters function. This one was a little bit more tricky because the name of the production studio occupies the same tags as writers on the IMDB page. Luckily the list x which is returned by the soup.find_all() method groups writers with writers and production studios with production studios. I was able to specify I only want the first item (writers) by using x = x[0]. Next I’ll put these values into the MOVRatings DataFrame.
for i, row in MOVRatings.iterrows():
	titleID = imdbPage+str(row["IMDB ID"]+"/")
	MOVRatings["Director"].iloc[i]=findDirectors(titleID)
	MOVRatings["Writers"].iloc[i]=findWriters(titleID)
	MOVRatings["Actors"].iloc[i]=findActors(titleID)
Here are the columns which I created earlier being filled. This code goes row by row through the MOVRatings DataFrame and does two things: First, it creates the titleID variable which combines the imdbPage variable I created at the very beginning to the value of the “IMDB ID” and a “/” at the end. This is the main page for each title. Second, it sets the value of the “Directors”, “Writers”, and “Actors” columns for the current row equal to the result of their corresponding functions. This means that the values of each of these columns will be a list of directors, writers, and actors who worked on the movie.
| Unnamed: 0 | title | year | title_type | rate | rating_date | rating_source | IMDB ID | Director | Writers | Actors | |
|---|---|---|---|---|---|---|---|---|---|---|---|
| 0 | 0 | The Monuments Men | 2014 | Movie | 6 | 2015-05-25 00:00:00 | Jinni | tt2177771 | [George Clooney] | [George Clooney, Grant Heslov] | [George Clooney, Matt Damon, Bill Murray] |
| 1 | 1 | Sleepwalk with Me | 2012 | Movie | 9 | 2015-05-25 00:00:00 | Jinni | tt2077851 | [Mike Birbiglia, Seth Barrish] | [Mike Birbiglia, Ira Glass] | [Mike Birbiglia, Lauren Ambrose, James Rebhorn] |
| 2 | 2 | Seven Psychopaths | 2012 | Movie | 6 | 2015-05-25 00:00:00 | Jinni | tt1931533 | [Martin McDonagh] | [Martin McDonagh] | [Colin Farrell, Woody Harrelson, Sam Rockwell] |
| 3 | 3 | Running Scared | 2006 | Movie | 6 | 2015-05-25 00:00:00 | Jinni | tt0404390 | [Wayne Kramer] | [Wayne Kramer] | [Paul Walker, Cameron Bright, Chazz Palminteri] |
| 4 | 4 | Thor | 2011 | Movie | 5 | 2015-05-25 00:00:00 | Jinni | tt0800369 | [Kenneth Branagh] | [Ashley Miller, Zack Stentz] | [Chris Hemsworth, Anthony Hopkins, Natalie Por… |
Looking good so far. Now that I have the information in my main DataFrame, I will make three more DataFrames for each of the types of people who worked on the movie. These DataFrames will include columns for names, a total rating number, the number of ratings, average ratings, max rating, min rating, and finally, a weighted rating which takes into account most of these things.
Final Data Wrangling
actors, directors, writers = [], [], [] ###Three new lists of names
These three lists will be filled by each unique name. Since I’m mostly interested in individuals whose work I consistently enjoy, it’s important that my new DataFrames compile all the ratings for each director, writer, or actor in one row.
###Add unique names to new lists
for i, row in MOVRatings.iterrows():
	for person in row["Director"]:
		if person in directors:
			pass
		else:
			directors.append(person)
	for person in row["Writers"]:
		if person in writers:
			pass
		else:
			writers.append(person)
	for person in row["Actors"]:
		if person in actors:
			pass
		else:
			actors.append(person)
Here I am again iterating through each row of the MOVRatings DataFrame. I next check if the person in the “Director” column is already in the directors list. If it the name is not in it, I add it to the list. I do the same for writers and actors, appending each unique name to their respective list. These lists will eventually serve as the basis for three new DataFrames. The rest of the columns still need to be named and created.
###Create new dataframes and column headers within them
y = ["Director", 'DTotalRate', 'DNumRatings', 'DAvgRate', 'DWeightRate', 'Max', 'Min', 'Writer',
'WTotalRate', 'WNumRatings', 'WAvgRate', 'WWeightRate', 'Max', 'Min', 'Actor', 'ATotalRate', 'ANumRatings',
'AAvgRate', 'AWeightRate', 'Max', 'Min']
DirRatings = pd.DataFrame(columns = y[0:7], index = range(0, len(directors)))
WritRatings = pd.DataFrame(columns = y[7:12], index = range(0, len(writers)))
ActRatings = pd.DataFrame(columns = y[14:], index = range(0, len(actors)))

###populate new DataFrames with names
i = 0
for dir in directors:
	DirRatings["Director"].iloc[i] = dir
	i+=1
i=0
for writ in writers:
	WritRatings["Writer"].iloc[i] = writ
	i+=1
i=0
for act in actors:
	ActRatings["Actor"].iloc[i] = act
	i+=1

###Populate rest of DataFrame columns with numbers
DirRatings.loc[:,'DTotalRate':]=0
WritRatings.loc[:,'WTotalRate':]=0
ActRatings.loc[:,'ATotalRate':]=0
y is a list of what I want my columns for the new DataFrames DirRatings, WritRatings, and ActRatings to have. I create the new DataFrames specifying which y values should be used in each DataFrame as column headers, and creating rows with the index parameter which spans from 0 to the length of the list of names I just created above. Next it’s time to populate these fields with names. I used a simple for loop and counter (i) to put each name from the lists directors, writers, and actors into successive rows. Last, I set the rest of the values which will later be filled with numbers to 0.
To finish up with the data I wrote three functions which will complete the three new DataFrames.
def totalRateNumRatings(origPersonCol, newColName, newDataFrame, totalRateCol, numRateCol):
	#origPersonCol - column name of original column containing name (eg Director, Writers, Actors)
	#newColName - name of new column containing name (eg Director, Writer, Actor)
	#newDataFrame - newly created DataFrame name (eg DirRatings, WritRatings, ActRatings)
	#totalRateCol - name of target column for total rating
	#numRateCol - name of target column for number of ratings
	origPersonCol, newColName, totalRateCol, numRateCol = str(origPersonCol), str(newColName), str(totalRateCol), str(numRateCol)
	for i, row in MOVRatings.iterrows():
		for person in row[origPersonCol]:
			for i2, row2 in newDataFrame.iterrows():
				if person == row2[newColName]:
					newDataFrame[totalRateCol].iloc[i2]+= row["rate"]
					newDataFrame[numRateCol].iloc[i2]+= 1

totalRateNumRatings("Director", "Director", DirRatings, "DTotalRate", "DNumRatings")
totalRateNumRatings("Writers", "Writer", WritRatings, "WTotalRate", "WNumRatings")
totalRateNumRatings("Actors", "Actor", ActRatings, "ATotalRate", "ANumRatings")

#Populate max and min
def maxMin(origPersonCol, newColName, newDataFrame):
	#origPersonCol - column name of original column containing name (eg Director, Writers, Actors)
	#newColName - name of new column containing name (eg Director, Writer, Actor)
	#newDataFrame - newly created DataFrame name (eg DirRatings, WritRatings, ActRatings)
	origPersonCol, newColName = str(origPersonCol), str(newColName)
	for i, row in newDataFrame.iterrows():
		min = 10
		max = 0
		for i2, row2 in MOVRatings.iterrows():
			if row[newColName] in row2[origPersonCol]:
				if row2["rate"]<min:
					min = row2["rate"]
				if row2["rate"]>max:
					max = row2["rate"]
		newDataFrame["Max"].iloc[i] = max
		newDataFrame["Min"].iloc[i] = min

maxMin("Director", "Director", DirRatings)
maxMin("Actors", "Actor", ActRatings)
maxMin("Writers", "Writer", WritRatings)

###Calculate average rating and weighted average rating
def avgWgtAvg(DataFrame, TotalCol, AvgRate, NumCol, WeightRateCol):
	for i, row in DataFrame.iterrows():
		DataFrame[AvgRate].iloc[i] = row[TotalCol]/row[NumCol]
		DataFrame[WeightRateCol].iloc[i]=((row[AvgRate]*row[NumCol])/(11-row["Min"]))*(row["Max"]/10)

avgWgtAvg(DirRatings, "DTotalRate", "DAvgRate", "DNumRatings", "DWeightRate")
avgWgtAvg(WritRatings, "WTotalRate", "WAvgRate", "WNumRatings", "WWeightRate")
avgWgtAvg(ActRatings, "ATotalRate", "AAvgRate", "ANumRatings", "AWeightRate")
totalRateNumRatings will fill the Total Rate and Number of Ratings columns. maxMin finds the max and min ratings for each director, writer, or actor. Finally, avgWgtAvg will calculate the Average and Weighted Average for each person. The Weighted average is something I came up with to give more credit to those whose work I consistently enjoy rather than ending up with “one hit wonders” at the top of my lists. The formula is:
[(Average Rating * Number of Ratings) / (10 – Minimum Rating)] * (Maximum Rating / 10)
Favorite Directors
Let’s see who my top 5 directors are with more than one rating.
import matplotlib.pyplot as plt
import matplotlib

matplotlib.style.use('ggplot')

plot = topDirectors.loc[topDirectors["DNumRatings">=2][0:6].plot(kind='bar', x='Director', y='DWeightRate', ylim=(0,20), legend=None, title = "Weighted Ratings, Directors")
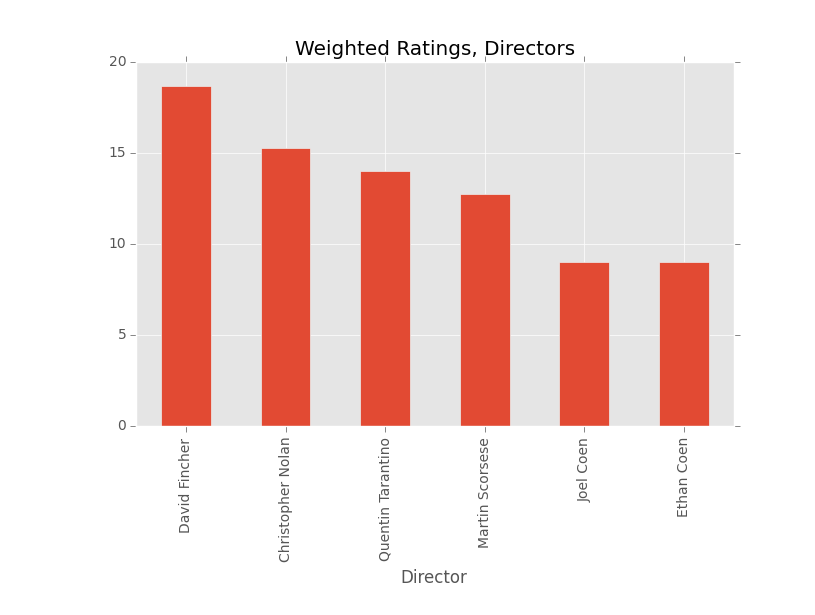
This is pretty spot on. David Fincher has made a lot of great movies like Se7en, Zodiac, The Social Network, The Girl with the Dragon Tattoo, and my favorite movie of last year, Gone Girl. The other guys on this list are nothing to sneeze at either, with many of them making a few of my favorite movies as well. Scorsese directed my favorite movie (The Departed), but also holds the distinction of creating the best movie scene of all time. He even put his mom in that scene.
Favorite Writers
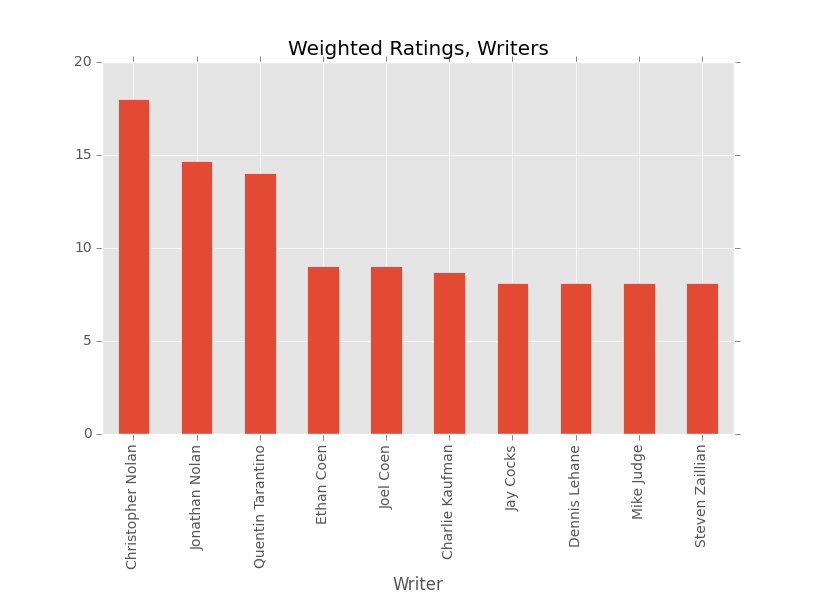
Again, this seems to be accurate. I really enjoy movies written by the Nolan brothers (although it seems like Christopher really gets me, you know?). Likewise, Tarantino and the Coens consistently blow me away with the stories they come up with.
Favorite Actors
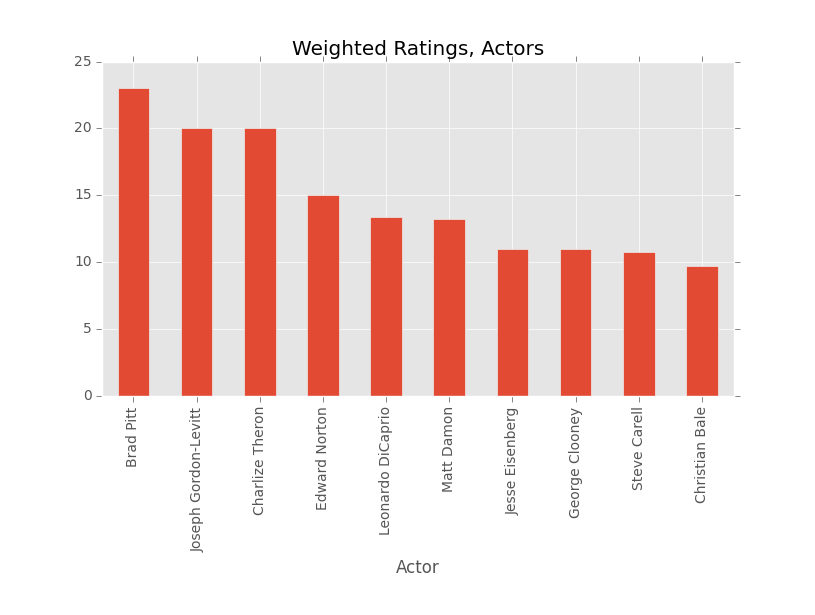
Let me start by saying that I consider Edward Norton to be my favorite actor, hands down. He’s fourth on this list because he doesn’t appear in a ton of movies, but when he does there is no question who is the most captivating guy on screen.
That being said, I am not ashamed of my love for Brad Pitt. I can’t think of a bad movie he’s done off hand. Twelve Monkeys, Se7en, Snatch, all three Ocean’s movies, Burn After Reading, and Twelve Years a Slave are all great movies. What’s more impressive is that he plays everything from a mental patient to some sort of a European bare knuckle boxer with an accent which doesn’t actually exist in real life. He has a few crossovers with David Fincher as well, so it makes sense that they’d both be at the top.
Fin
Not unlike David Fincher movies, the more I see Pandas the more I like it. The snappy syntax and the smooth, polished way it interacts with the rest of Python is reminiscent of Fincher’s stylized way of filming a scene. Forced comparisons aside, Pandas almost seems like a native python library. It’s that intuitive. Python’s power is also observed in this project. I’m always impressed by how easy it is to collect information which would take hours to do by hand. I was able to collect data on hundreds of movies and even more directors, writers, and actors in just a few lines of code. Matplotlib stands out with how easy it is to plot Pandas data in an aesthetically pleasing way. I hope to dive deeper into matplotlib in the future.
Thanks for reading! Let me know if you have any comments or concerns about my movie watching habits. Feel free to shoot me recommendations at osentand(at)gmail.com.